
Stat Sentry is out on the Mac App Store
Last week I wrote that two Mac apps were coming soon. The first one is here: Stat Sentry is now on the Mac App Store.
What it is
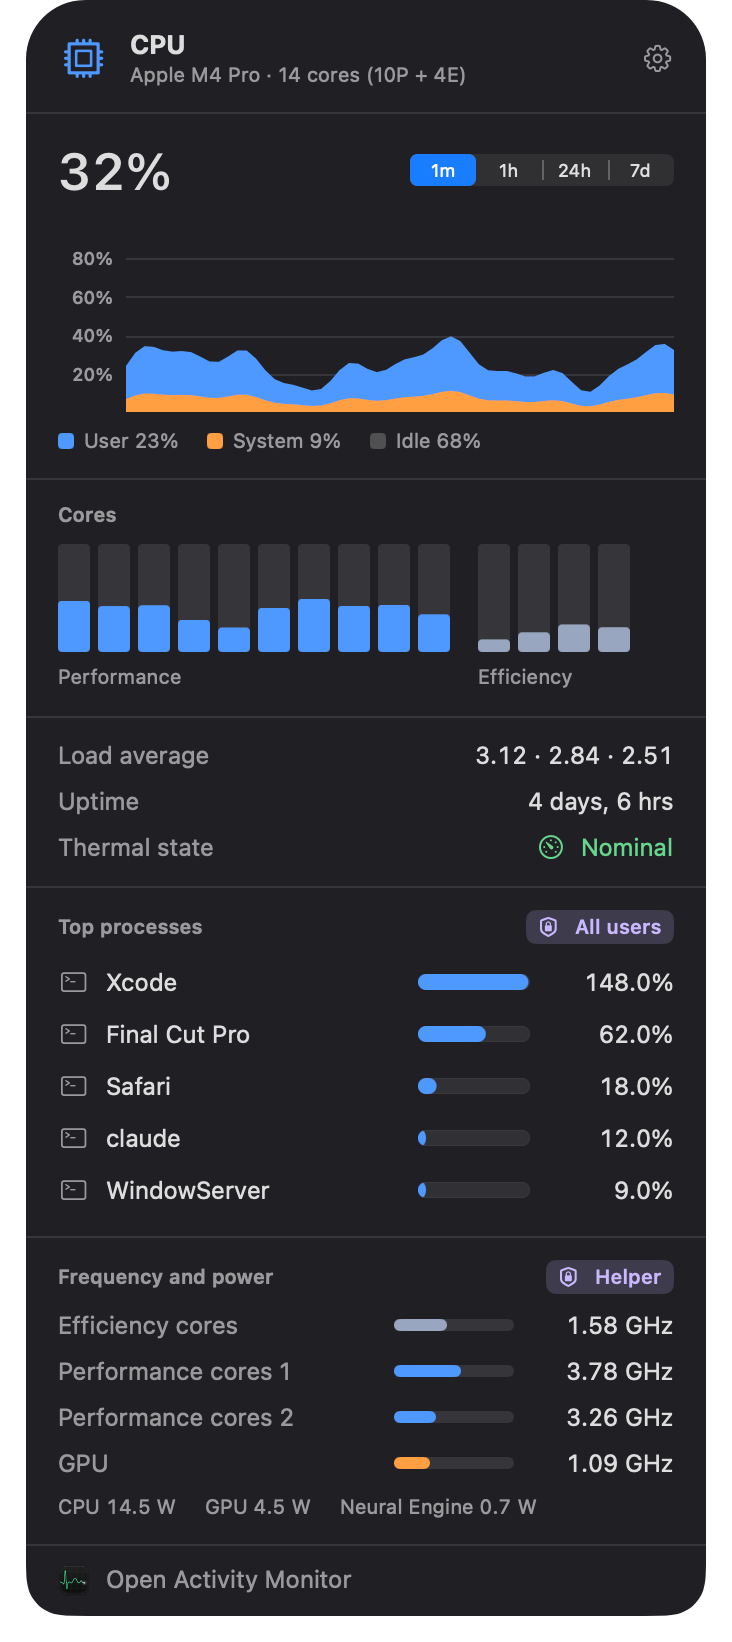
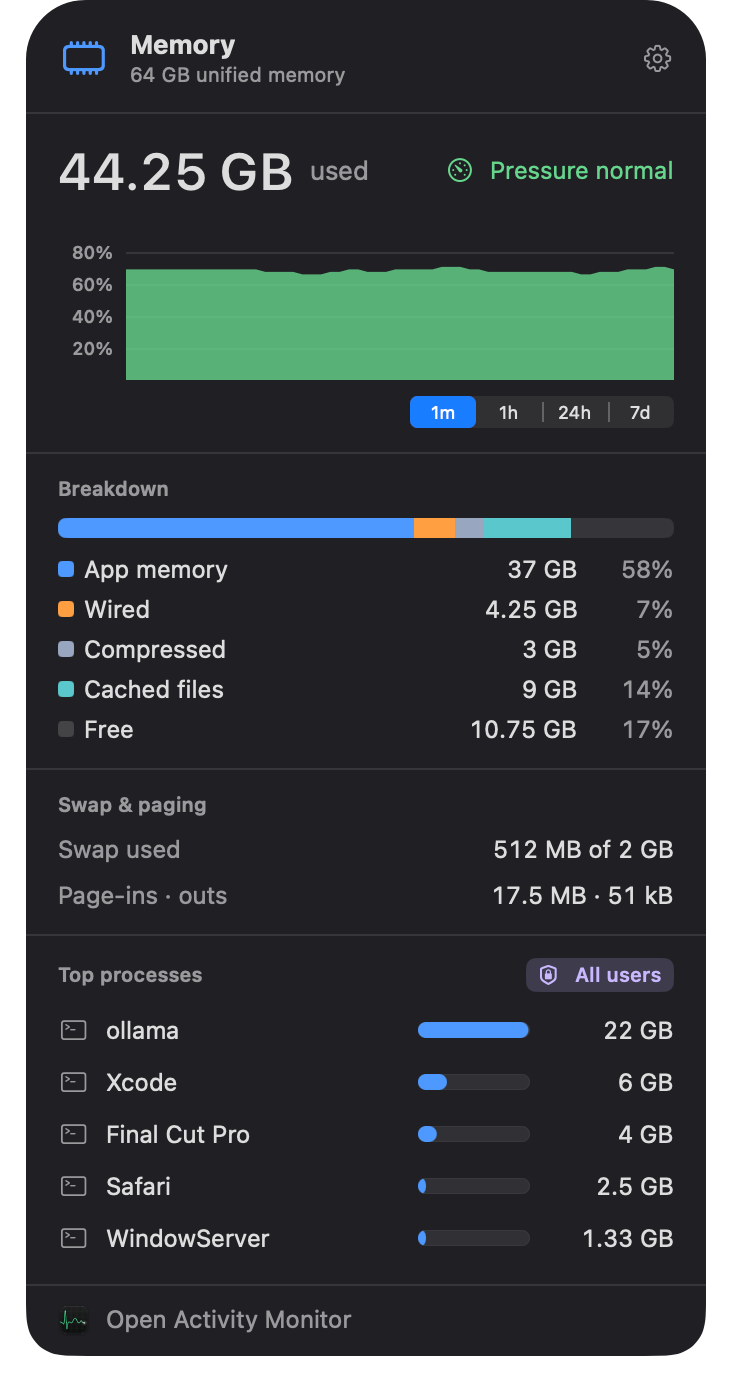
Stat Sentry is a menu bar system monitor for Macs with Apple silicon. Each part of your Mac gets its own menu bar item and a panel behind it, one click away:
- CPU & GPU — performance and efficiency cores apart, a bar per core, a minute of load history, thermal state with throttling shown, and the processes using the most.
- Memory — built around memory pressure, the number macOS itself goes by, with app, wired, compressed and cached memory, swap, and who’s holding the most.
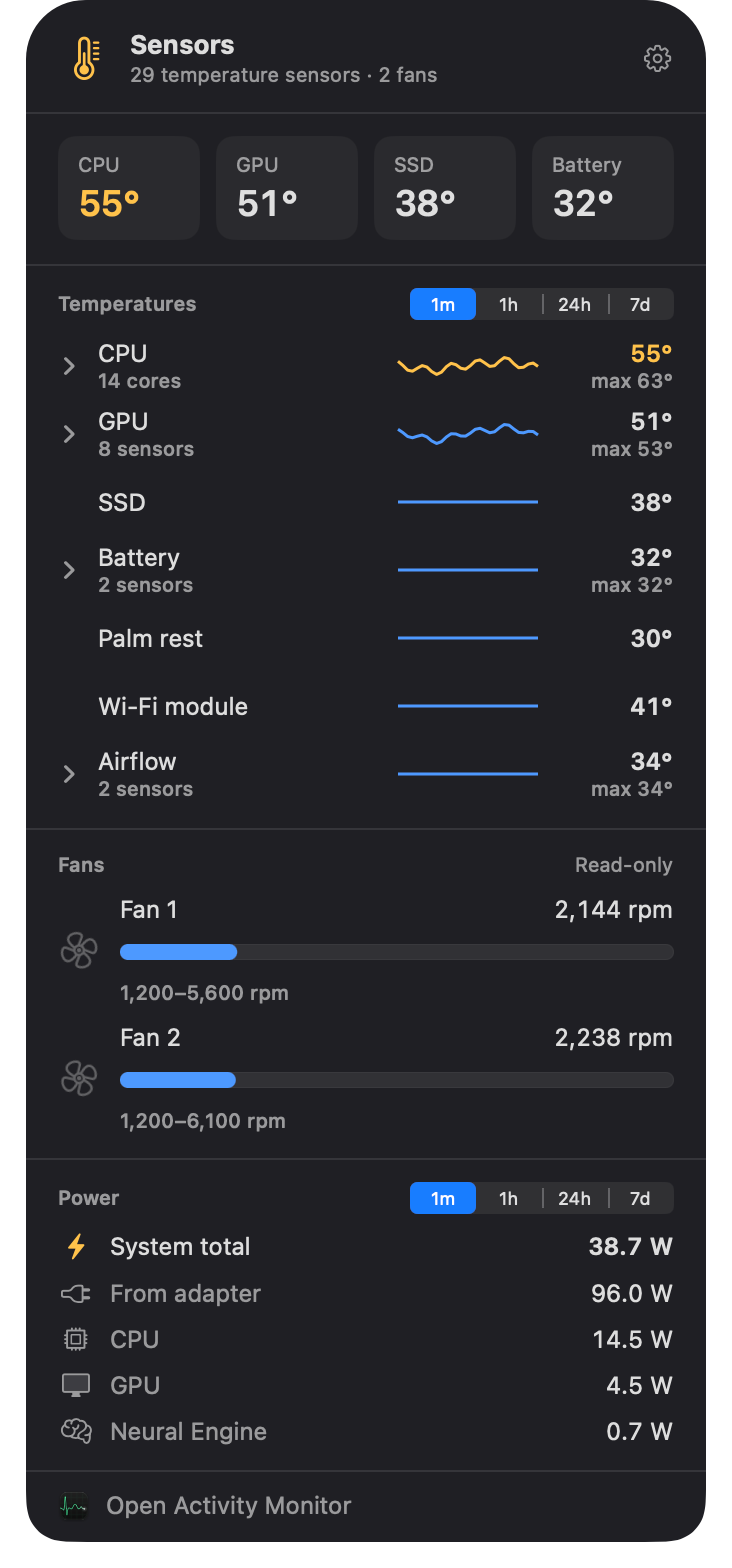
- Sensors — temperatures with real names (“Performance core 3”, not “Tp0D”), fan speeds, and power: what the Mac draws and what the adapter delivers.
- Disks — read and write speed, free space on every volume with one-click eject, and your SSD’s SMART health.
- Network — download and upload speed, Wi-Fi signal and link details, local and public IP, router, DNS and every interface.
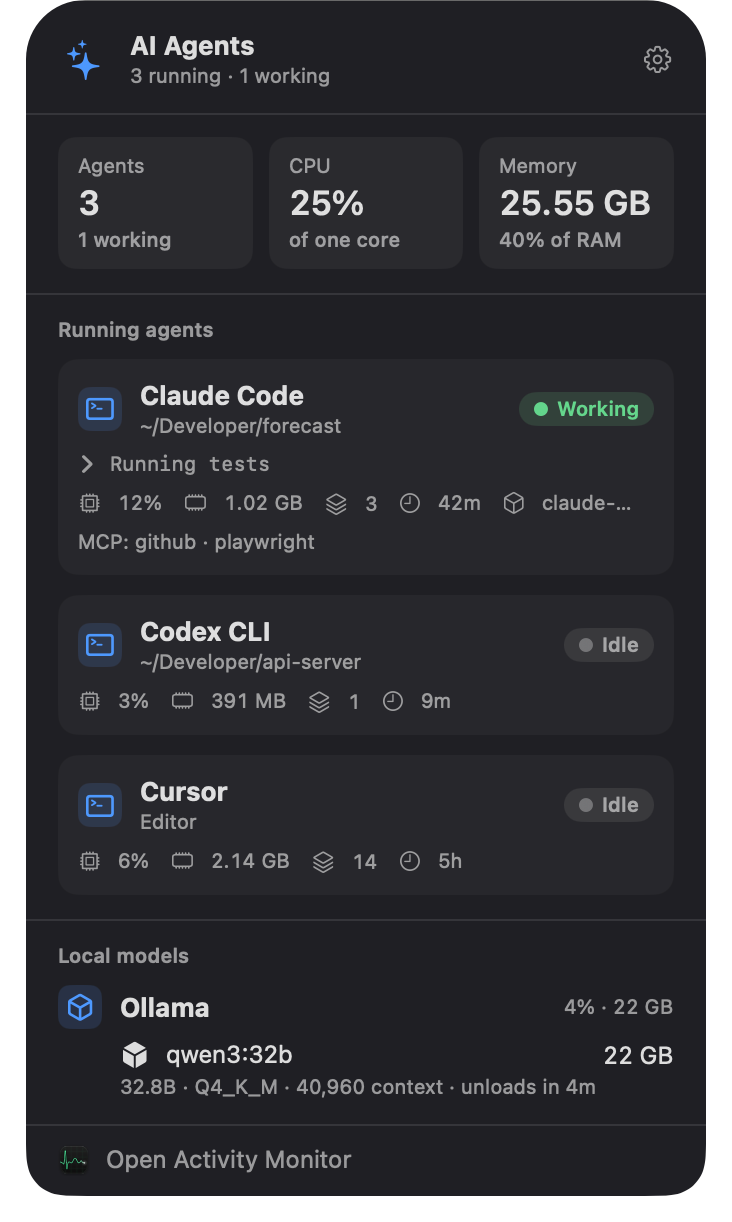
- AI agents — the one no other monitor has. More on it below.
Show the panels you care about and hide the rest. Hidden ones aren’t measured at all, which is how Stat Sentry stays light.
The agents panel
These days a Mac is rarely running just your work — there’s a coding agent or two in the background, and often a local model sitting in memory.
Stat Sentry finds them by itself: Claude Code, Codex, Gemini CLI, Cursor, Copilot, Aider and more. For each one you see whether it’s working or idle, the project folder it’s in, its CPU and memory, how many processes it has started and how long it has run — plus its MCP servers, by name. For Ollama it lists the loaded models with their size, quantization, context length, and when they’ll unload.
Alerts, before something runs out
You can set rules for memory, swap, disk space, drive health, the network and temperature. When one fires, Stat Sentry notifies you, tints the menu bar item, and opens the right panel when you click.
Two worth turning on: a critical alert when a local model is about to exhaust memory — with what’s holding it — and a quiet one when an agent finishes a long task.
Widgets
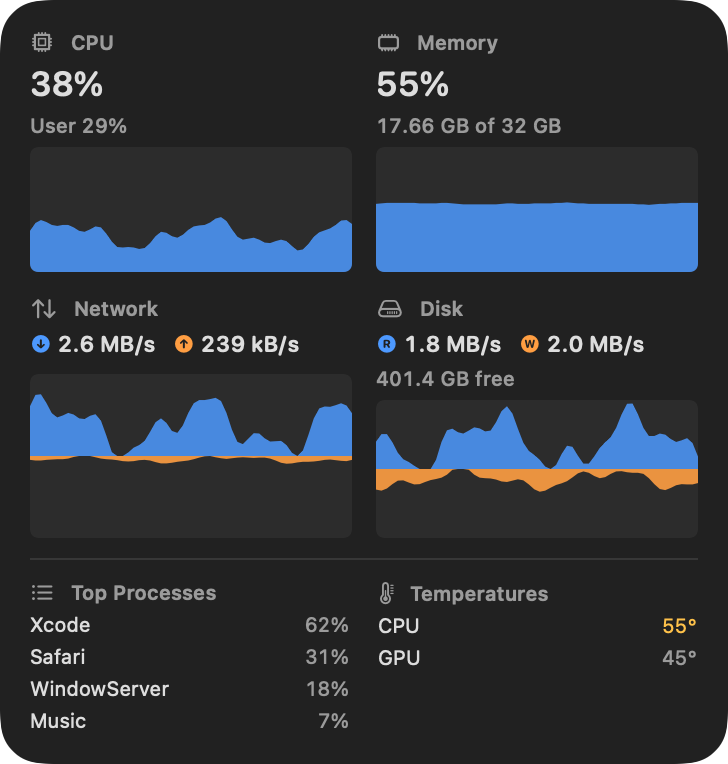
Stat Sentry also lives on the desktop and in Notification Center, in every widget size — from a single module with a ring, up to graphs for six. You choose what each widget shows, and clicking a module opens its panel. Only what your widgets show gets measured.
The Helper
Stat Sentry is a sandboxed App Store app, and the sandbox doesn’t allow everything. Temperatures, fans, power and every user’s processes (including WindowServer and kernel_task) come from the Stat Sentry Helper — a small, separate, read-only system service, installed with SMAppService and reached over XPC.
It’s optional and free. Without it, everything else works as usual.
Private by design
No account, no analytics, no tracking. Stat Sentry measures on your Mac and keeps it there. It only goes online when you ask it to: to look up your public IP, or to send a problem report you’ve read first.
Get it
$7.99, once. No subscription, and updates are free. Apple silicon, macOS 26 or later.
- Download Stat Sentry on the Mac App Store
- Everything about it at codice.pl/statsentry
- Get the free Helper
If something doesn’t work the way you’d expect, or there’s a reading you wish it had, write to me at piotr@codice.pl — this is version one, and I’m listening.
Agent Sentry is next. 🚀